Model Management
Model Management
Andes platform allows you plug in your own models to drive the risk tolerance test, and client onboarding flow.
Whether you build your own models or use third party models, it is important to make sure your models are adequate. If you don’t use models, Andes ships two sets of classic models out-of-the-box.

Compare, Validate and Troubleshoot Models
Andes platform offers a number of visual tools to help you validate, compare and troubleshoot your models, whether you build them in-house or use third party models.
Andes platform support strategic models, tactical models, and model of models (sleeves).
These visual tools give you unprecedented transparency and insights that you can’t get with other analytics tools.
Andes Risk Score
Many people want to see a 0-100 risk score. Andes Risk Score uses a simple algorithm to map to a risk score of 0-100 that is consistent with common perception, as well as the Morningstar Risk Score.
For very risky models, for example, a model with 100% TLSA or Bitcoin, Andes Risk Score can be much higher than 100, which also makes sense, because they are much riskier than a typical diversified 100% equity portfolio. In fact, the Andes Risk Score for TLSA is 300, and Bitcoin 400.
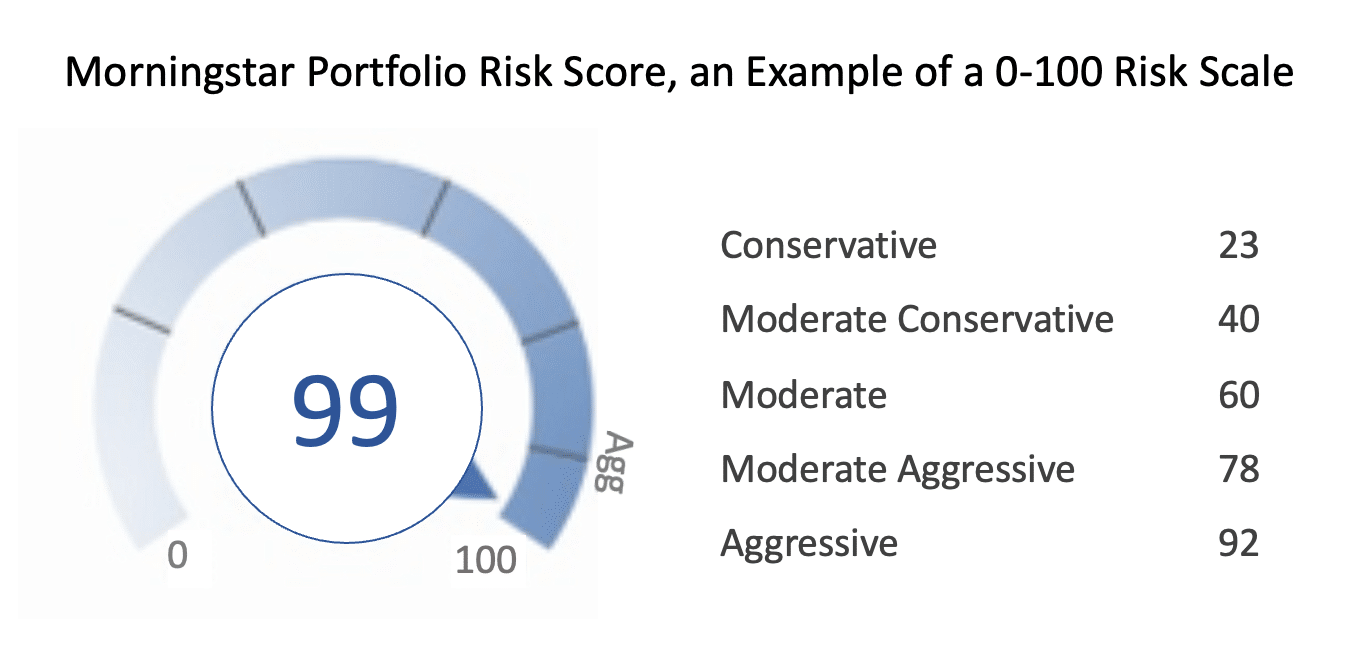
The simple algorithm is to multiple the model’s long-term volatility by five, because the volatility of a diversified all equity portfolio is right below 20, and it makes sense to map it to a risk score close to 100, to take advantage of the full 0-100 spectrum.
Back Test and Stress Test Models
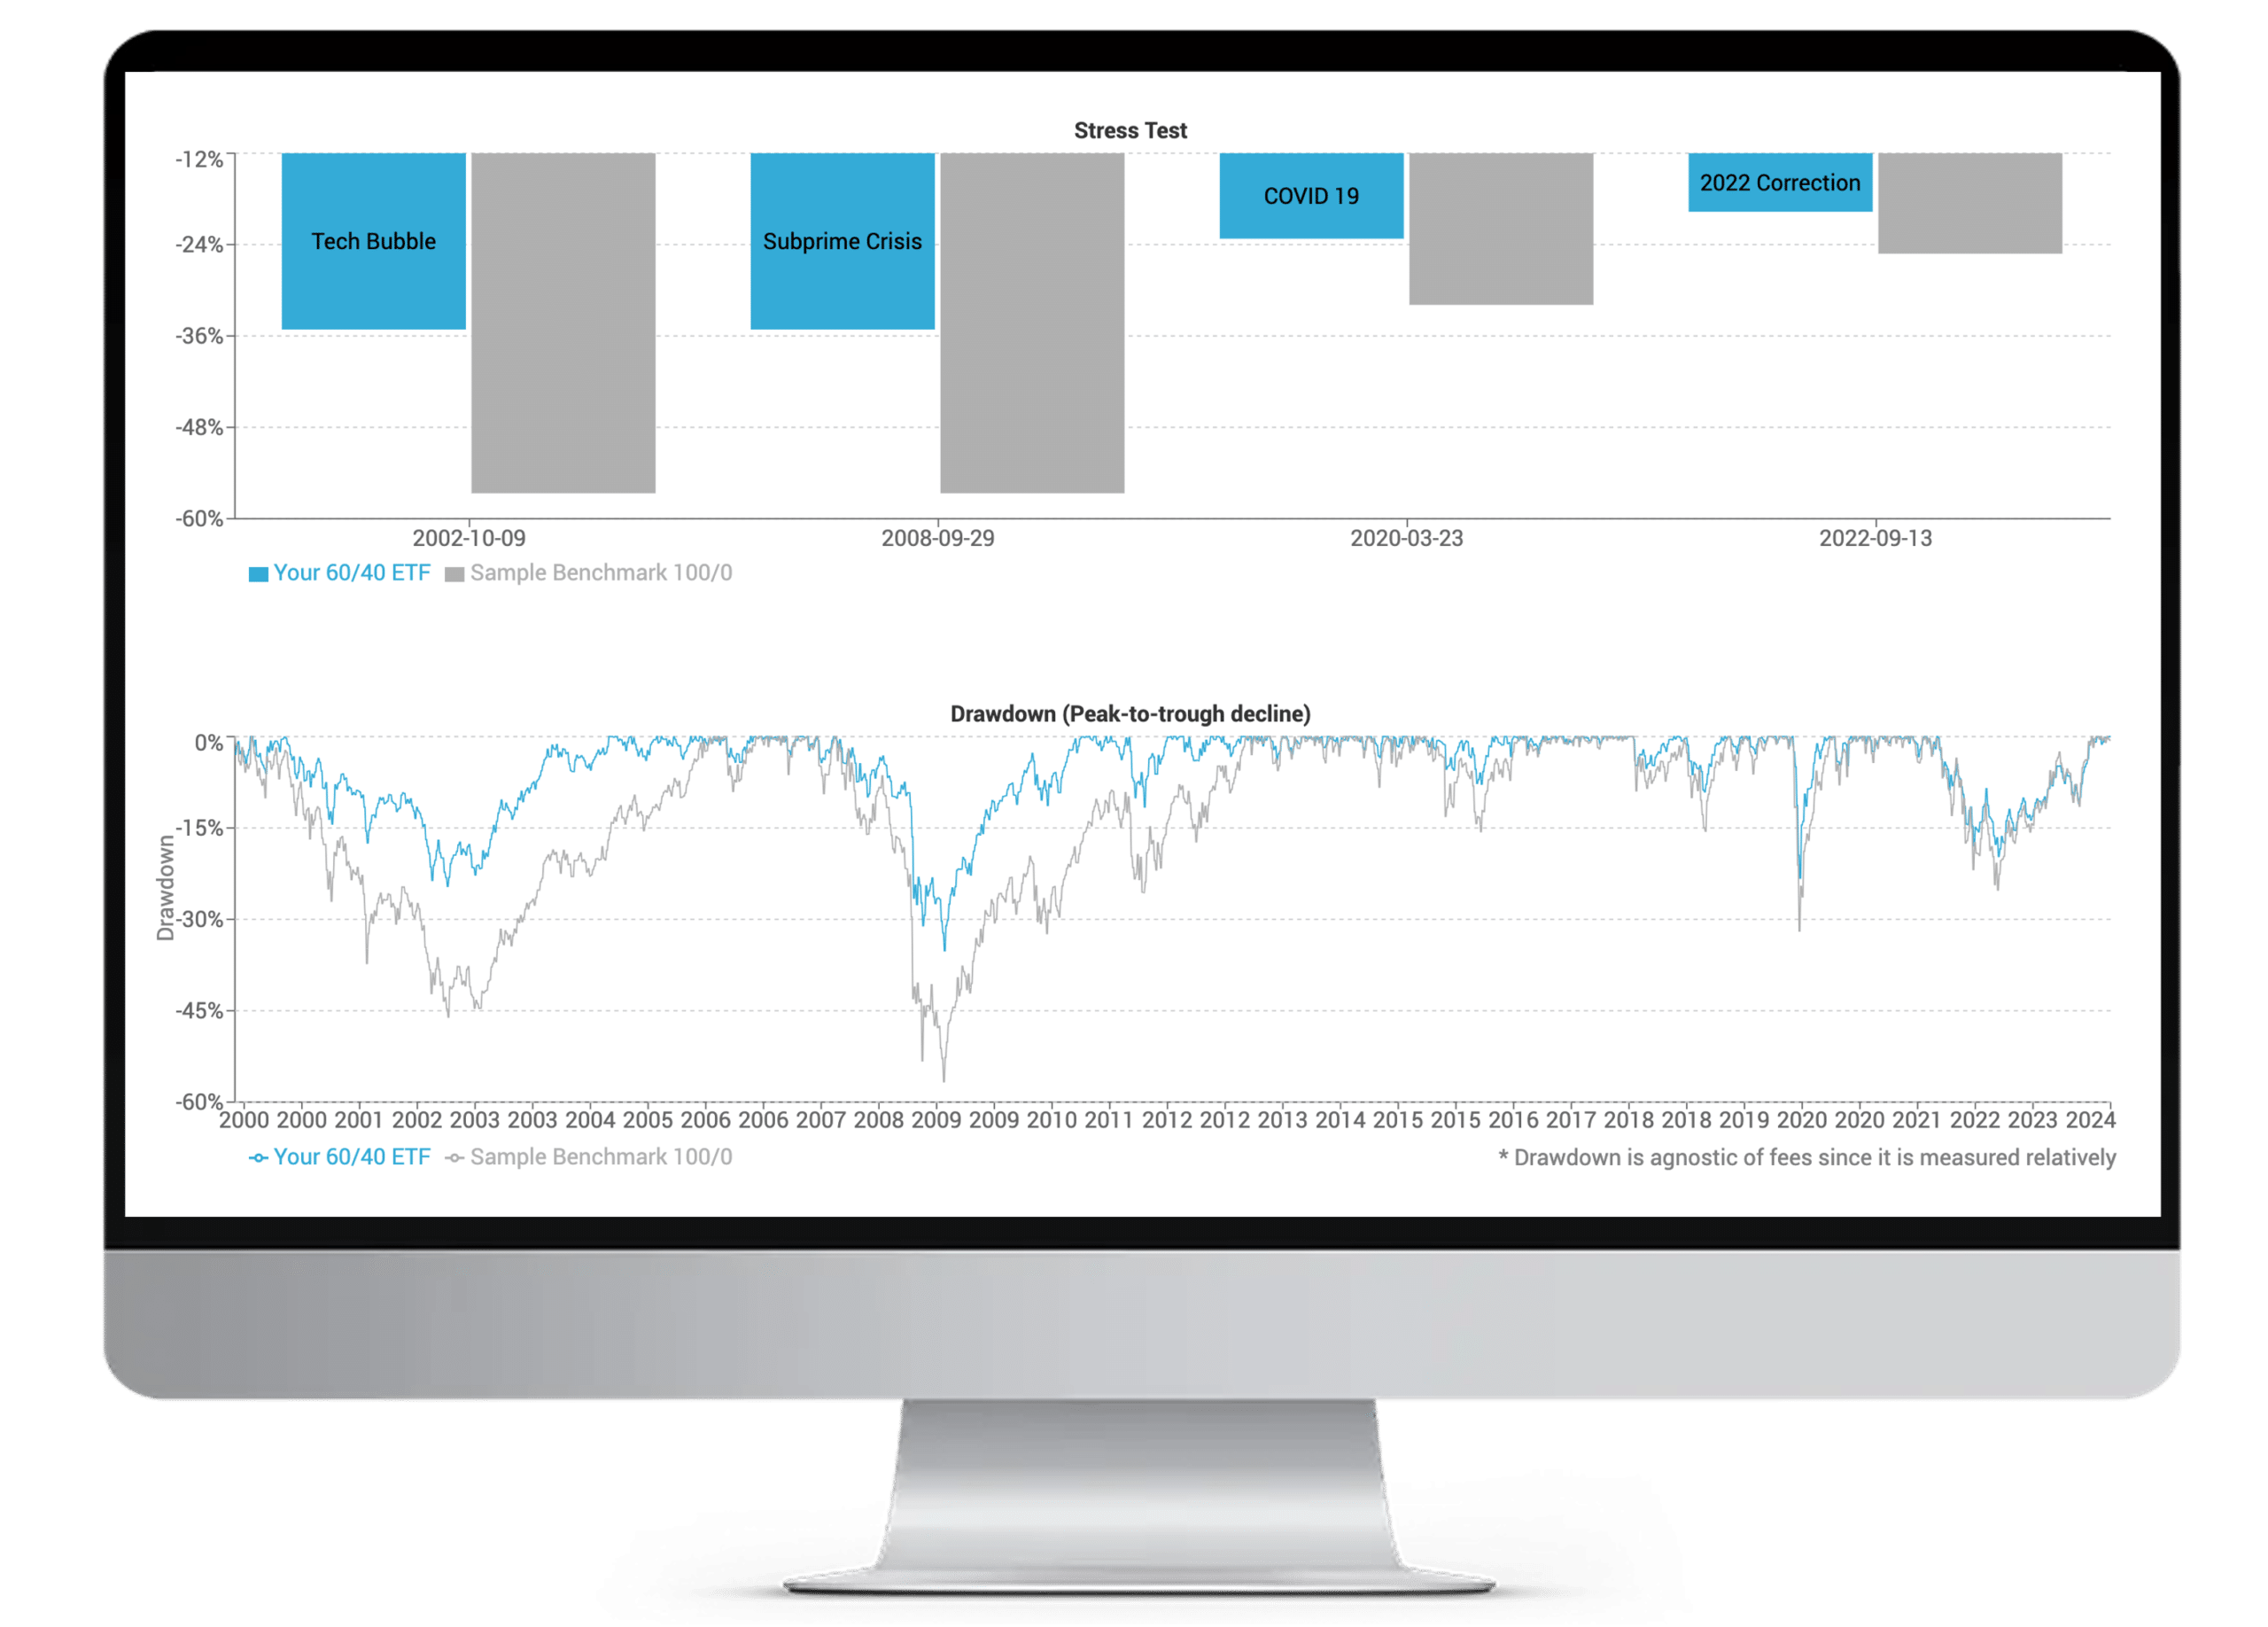
To validate your models, you can back test and stress test them in a number of ways, including annual returns, drawdown, growth of $1, best/worst risk and return, and rolling risk and return for any time period.
If you use third-party models, you can compare it with a classic model to make sure your third-party models are adequate.
It also calculates the long-term average risk and return (or any period) to help you set the capital market assumptions.
Compare Models
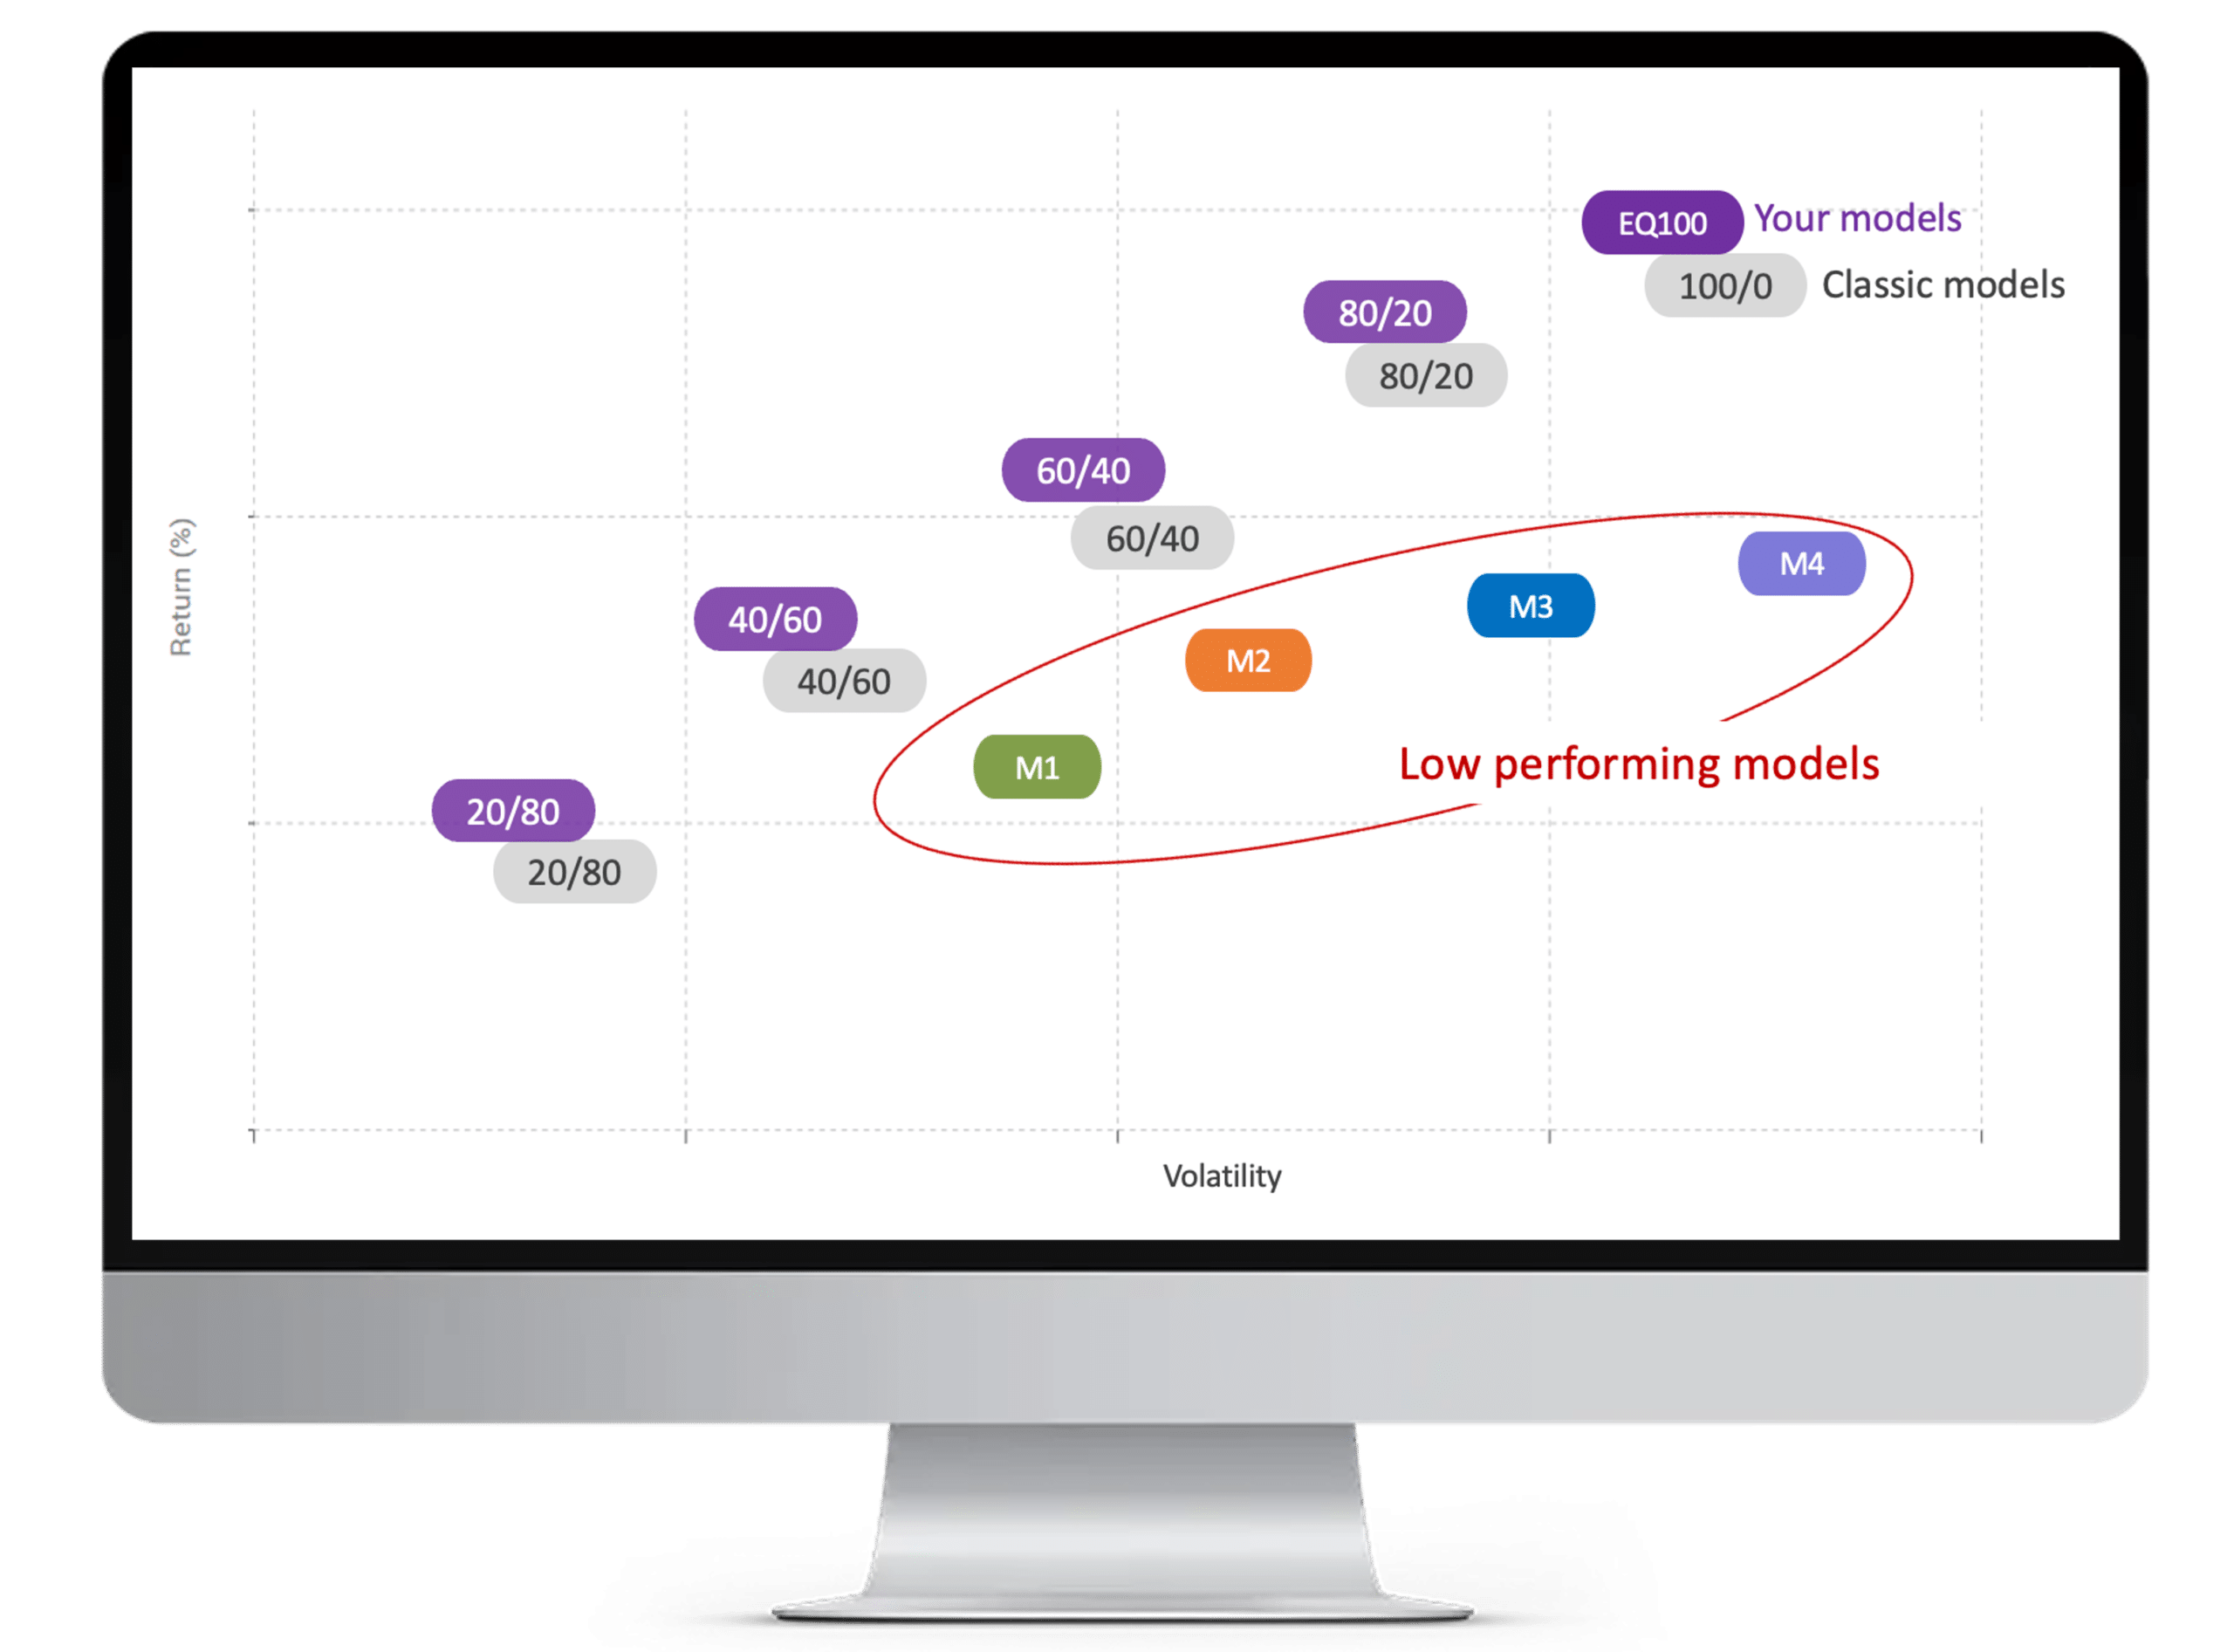
You can visually compare the risk and return of many models on one chart, for any time period.
In the chart, the gray models are classic models, the de-facto benchmark, that form an efficient frontier. If your models are doing well (the purple models), you can easily see that.
If you use third party models and they are not adequate (see red circle), you can quickly see it as well.
Troubleshoot Models
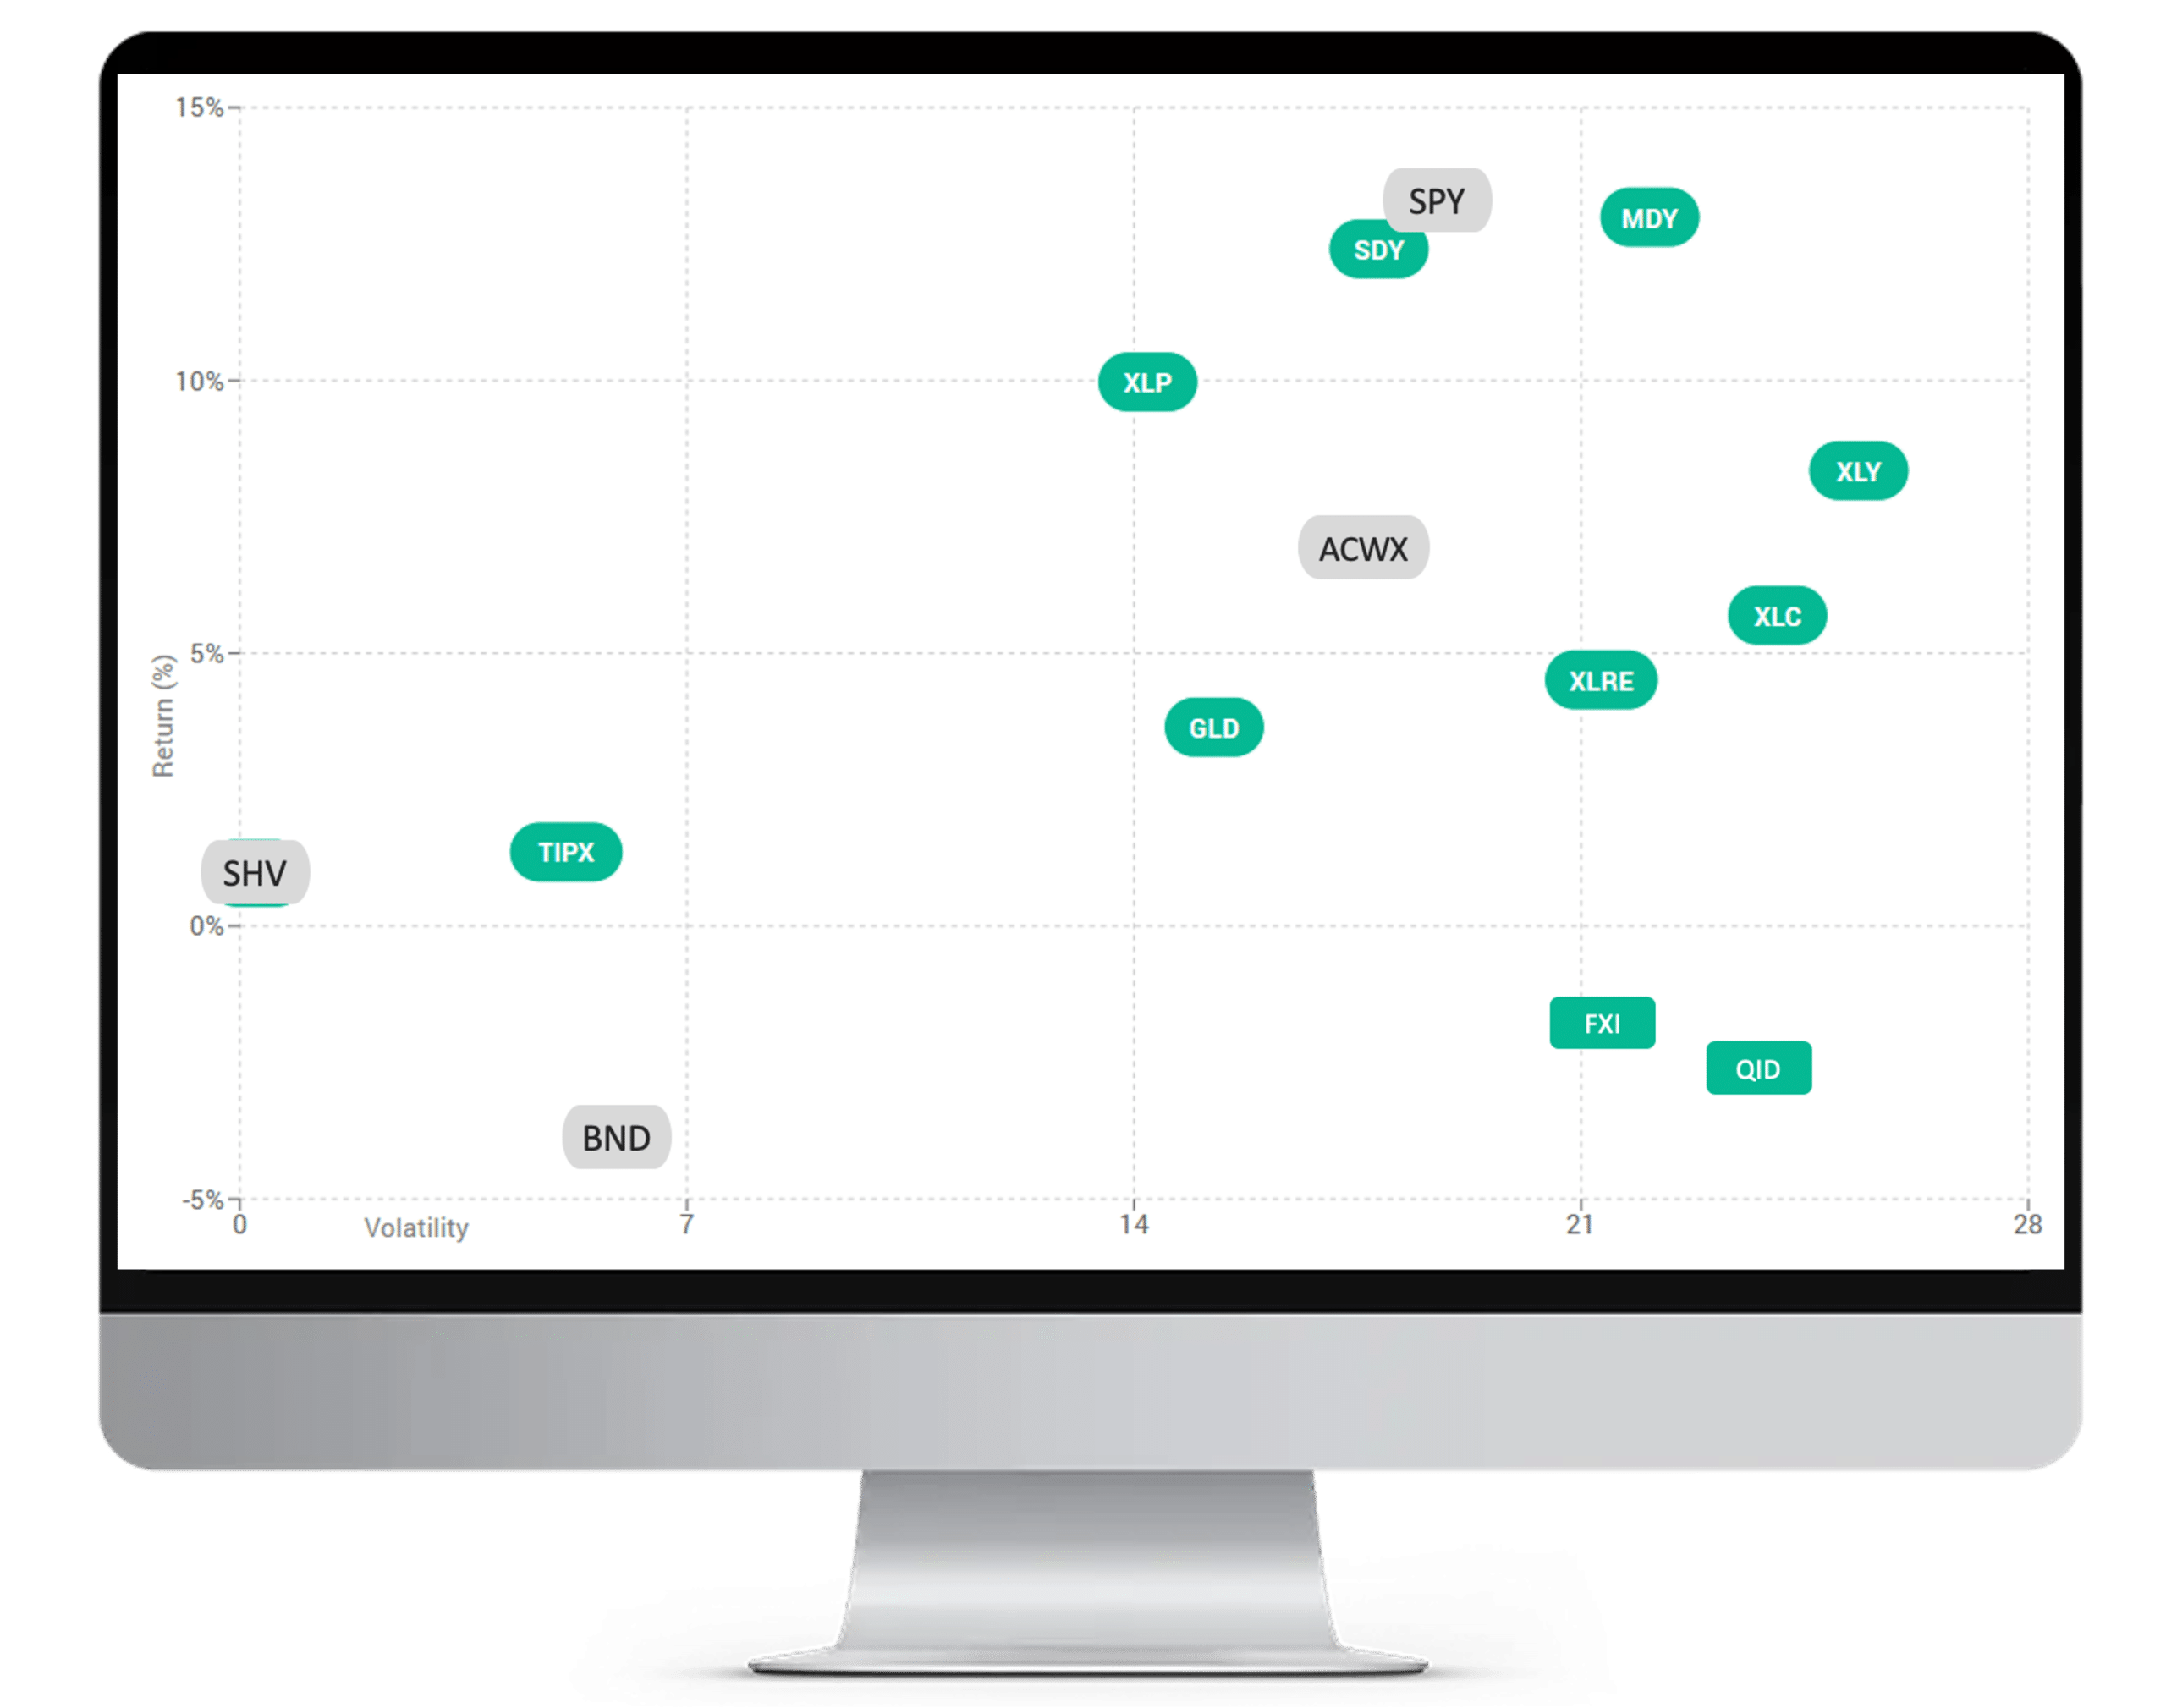
Andes has a different kind of performance attribution. Instead of the traditional factor and industry analysis, Andes simply plots all positions in your model and the benchmark model on one chart so you can visually compare.
The gray funds (SPY, ACWX, BND and SHV) are from the benchmark model and the green funds are from your models. It often gives you a clue of the factors and industries at play.
You can look at one-year or 30-year, or during any market condition.

