September 13, 2022, by Helen Yang, CFA, Advisor Perspectives
What is Risk Tolerance?
Risk tolerance refers to the investor’s inherent risk preference, i.e., how much risk they are willing to take in exchange for certain gains. In finance, it often refers to the risk and return tradeoff, since investments with higher returns usually have higher risk, subject to more losses during market downturn.
Many people believe that risk tolerance is not stable, because an investor’s attitude towards equity changes when market conditions change. If risk tolerance is indeed unstable, why do we bother measuring it, not to mention using it to drive investment decisions?
We believe the investor’s inherent risk preference is stable, and the changing attitude towards certain asset classes is caused by changes in risk perception.
How Does Risk Tolerance Tools Work?
Traditional risk questionnaires are easy to understand but lack precision. For example, how do you know that it should be a 60/40 portfolio, not 50/50 or 70/30? More importantly, many questionnaires don’t tell investors that they could lose money, causing problems down the road.
Some tools ask investors to choose an upside/downside tradeoff, which is good, but the tradeoffs presented to investors are artificial, not real, in that they don’t reflect the models used by financial advisors.
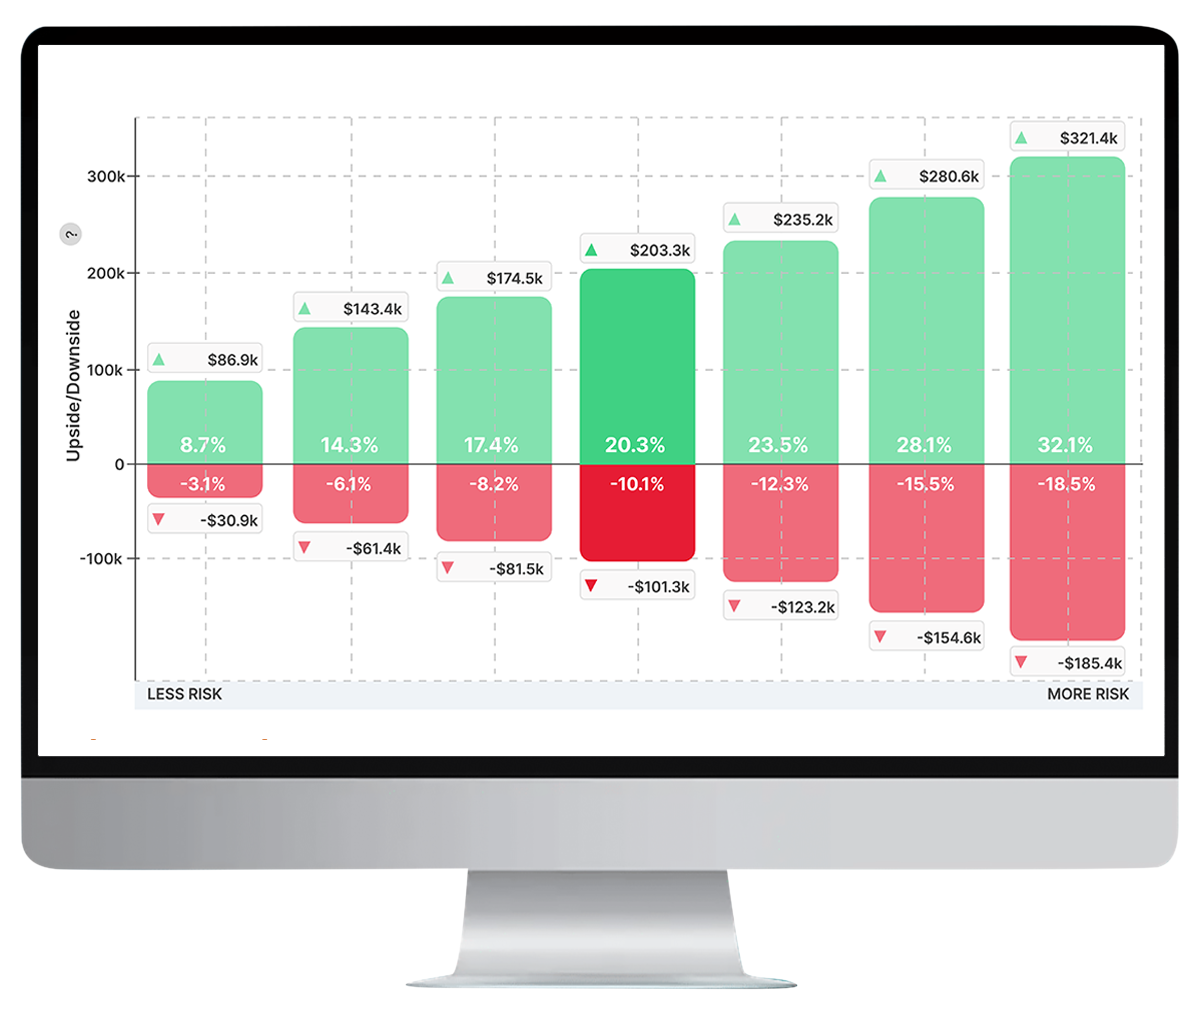
If the end goal is to assign a model portfolio to the client, why don’t we show the gains and losses of the advisor’s models and ask the client to pick the tradeoff that they feel most comfortable with? This way, the client’s choice maps directly to the advisor’s models. This is the approach I take.
In this figure, an investor picks an upside/downside tradeoff that they feel most comfortable with, making it the most direct, transparent, and defensible approach.

Telling the Long Term Story
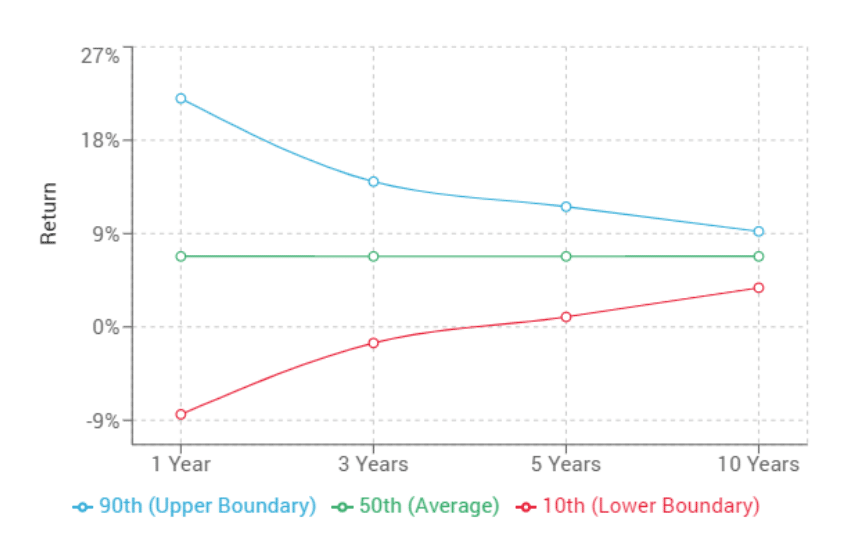
Now, telling the long term story – This chart shows how the return of the 60/40 portfolio can vary greatly from year to year, but if you look at longer time periods, the outcomes become more and more certain. If the investor has a 10-year or longer time horizon, they don’t have to worry about the fluctuations from year to year.

Infusing With Behavioral Finance
We can also infuse this risk tolerance assessment with behavioral finance. For example, the investor type helps advisors better understand how clients behave when the market goes up and down. Adapted from the research by Dr. Andrew Lo from MIT, I use a mini questionnaire to determine if an investor is passive, a trend follower, or contrarian.
Summary
Risk tolerance assessment is a cornerstone in wealth management. Getting it right ensures appropriate asset allocation that matches the client’s risk appetite and financial circumstances.
More importantly, by having robust conversations about risk and reward, and documenting it in the investment policy statement, advisors can set expectations and tell a compelling long-term story, which will prevent problems during market turmoil.
Dan Song, CFA, partner and portfolio manager at Westfield Financial Planning, a NJ-based RIA, said,
“When the markets are down, you come to us and perhaps look to change your investment portfolio at the worst possible time. We will pull up your IPS, show you the questionnaires we went through, and remind you that you were comfortable with, say, the 60/40 portfolio.
To date, we haven’t had to do it. But we let clients know ahead of time that if the market drops and they want to get out at a bad time, we will remind them we did this IPS when cooler heads prevailed.”
This article was originally published by Advisor Perspectives.


